Friday, August 16, 2013

Visualizing Internet Activity

I've recently been playing with the idea of visualizing the network demand for various activities related to everyday Internet use. Most times the browser presents a view that abstracts this behind-the-scenes activity to provide a seamless experience to the user. Even so, it can be enlightening to peel back the layers just a bit to peek at what is really happening.

In the images below I've tried to present this underlying activity in a way that is intuitive without drowning the reader with information. This is still a work in progress but I feel as though this is a decent start toward that goal.

The graphs below represent network traffic related to three types of activity one might typically engage in while online: browsing facebook, watching a youtube video, and downloading a large file. Each 'bubble' represents a packet; radius is the relative packet size; individual connections are annotated with unique colors; and I add jitter in an attempt to alleviate over-plotting.


The above is the graph for facebook. There is an initial burst of activity to load all the components when you first log in; as you scroll down the page more content is loaded to extend the page on-demand (these are the narrow vertical impulses throughout the graph); then, around time 250 there is a large amount of activity related to opening a photo album and browsing through the pictures. As can be seen by the transitioning colors there are a variety of individual connections used over the course of the facebook session.


This next graph is a view of what happens when watching a youtube video. Again, there is a quick burst to load the page and several connections are used to do this. Once the video is playing, however, there is only very periodic bursts of activity. In fact, if you observe the video progress bar as you watch the video you will notice that youtube front-loads a portion of the video immediately and then, as you start to need more content, requests the next section of the video.


Finally, this is a view of what a large file download requires: very few connections and a consistent, heavy flow of packets across the network.

From an end user point-of-view, the experience related to each of these activities is the same: open a browser, click a few buttons and receive content. The resources and demand to deliver this content, however, is entirely distinct from that experience.

Friday, July 19, 2013

Column-Major Confusion

As a programmer coming from a language like C I am used to understanding multidimensional arrays in the following way:
int matrix[3][3] = {
    { 1, 2, 3 },
    { 4, 5, 6 },
    { 7, 8, 9 }
};

Understandably, this is a little bit of a setback when trying to grok how a language such as R handles matrices. The example above is 'row-major' but R uses 'column-major' by default. Note that I'm not describing memory layout here - which coincidentally is the same as my description - I referring to how the matrices are presented to the programmer. To complete the example, here is how I would create the same matrix as above in R:
> matrix(1:9,ncol=3)
     [,1] [,2] [,3]
[1,]    1    4    7
[2,]    2    5    8
[3,]    3    6    9

There is no problem with this per se. In fact, I'd imagine that R programmers that come to something like C may feel similar unease in the paradigm shift. I'm finding that this fact is glazed over in some texts offering an introduction to R. This happens in non-obvious ways. In particular, I found this example today:
> matrix(c(1,0,0,0,1,0,0,0,1),ncol=3)
     [,1] [,2] [,3]
[1,]    1    0    0
[2,]    0    1    0
[3,]    0    0    1

The identity matrix is a particularly bad choice in this regard as it gives no indication of the true layout being used. It is probably good for any tutorial using matrices to cover an obvious simple case first to set the stage before moving directly to something like the identity matrix (or any other symmetric matrix for that matter).

Saturday, July 13, 2013

10 points: 10 plots

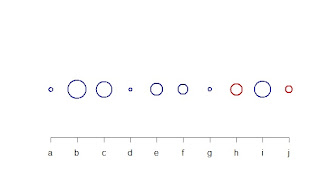
As an exercise in expanding my ability to display data I challenged myself to present 10 data points in 10 ways that were as distinct as possible. The idea was simple: use 10 random data points; minimize the axis and other ancillary information so as to focus on the data as much as possible; and try to minimize the overlap between each of the approaches.

Initially, I expected this would be a trivial task - something that would take a single sitting and a little bit of thought. A few attempts later and I kept circling back on a few common ideas while considering just how many approaches I'd not considered. What exists below is a collection of the results of that exercise with explanation if necessary.

1 - Standard Cartesian (scatterplot)


2 - Derivative Cartesian: uses labels instead of points to eliminate the need for tick marks on the x-axis.

3 - Impulses. Mixing the number and characters on the x-axis tick marks is questionable and could just as well have been labels at the top of each impulse

4 - Sorted derivative Cartesian

5 - Boxplot

6 - Barplot

7 - Radial. Points are interpreted as radians and placed starting from 0 radians

8 - Heatmap

9 - Cumulative Sum

10 - Financial/Intensity: Positive values are blue, negative are red. Absolute values define the radius of the circle used.


I considered others such as LOESS fit but they either needed the points to accompany them (to show what was being fitted) which made them too close to the Cartesian plot, or they were too complex for just 10 points.

It was interesting to see how difficult it turned out to be to stretch 10 points into 10 distinct presentation approaches.

Thursday, June 27, 2013

Walk this way

I recently found a handy mechanism for walking a directory tree in Linux. In
general, the way I used to do this was to use facilities found in dirent.h and
write my own recursive directory walker. Something similar to:

#include <stdio.h>
#include <string.h>
#include <dirent.h>

void reclist (const char* dirname) {

    DIR* dir = opendir (dirname);
    struct dirent* entry = 0;
    char name[1024] = {0};

    if (! dir) { return; }

    entry = readdir (dir);
    while (entry) {
        if (strncmp (entry->d_name, ".", 1)) {
            switch (entry->d_type) {
                case DT_REG:
                    printf ("%s\n", entry->d_name);
                    break;
                case DT_DIR:
                    snprintf (name, 1024, "%s/%s", dirname, entry->d_name);
                    reclist (name);
                    break;
            }
        }
        entry = readdir (dir);
    }
    closedir (dir);
}

int main(int argc, char** argv) {
    const char * dir = ".";
    if (argc == 2) { dir = argv[1]; }
    reclist (dir);
    return 0;
}

While that does work, it is rather verbose (especially once you get used to
environments like Ruby and Python). It turns out that ftw.h provides a more
concise way to do the above while managing all the little details like
avoiding '.' and '..' and managing the current path string. Here is what that
looks like to do the same as the above:

#include <stdio.h>
#include <ftw.h>

int handle_entry (const char *entry, const struct stat *sb, int type) {
    if (type == FTW_F) {
        printf("%s\n", entry);
    }
    return 0;
}

int main() {
    ftw(".", handle_entry, 10);
    return 0;
}

I also like the fact that a callback is used to operate on each of the files
found. It makes managing changes much easier as the tree walking is separated
from the code that handles the logic associated with inspecting the files.

Sunday, June 23, 2013

That's the key

A while back I cam across a post on Stephen Wolfram's blog where he presented the personal analytics of his life. As part of this post, there is a plot showing the keystroke activity of his life over the last 10 years. I want to ignore the resolve needed to conduct such an experiment for a moment and consider how he might have set something like that up.

[Update: see the corollary to this post - generating keyboard events - here]

I'm interested in data. I have a few logs of things I do on a daily basis but they are all collected proactively - I write entries into these logs in order to keep them current. I want to set up something similar to this key logger to automate this process for me. I'll mostly ignore that this is a potential security risk in that I will be capturing all keystrokes on the computer - including username and password information. To partially mitigate this I wont store the key information, I'll only keep the time the event occurred. This limits the amount of information in my database - I wont be able to see how my distribution of characters matches that of commonly used data, for instance - but it saves me from having to worry about how and where I store this information. Stephen Wolfram's post includes details about the actual keys so if my data starts to look interesting perhaps I'll transition to keeping that information as well.

I run Linux so I figured this would be rather straightforward: somehow hook into the X windowing subsystem and register for all keyboard events. Unfortunately, such an approach is not directly possible using Xlib (depending on which stackoverflow answer you read, it may not be possible at all). It turns out that it is rather difficult to ask X to just 'give me everything.' Things, as it were, are destined for a particular location (read: window) and asking for other windows' events doesn't make much sense in the general case. I had hoped there would be something akin to a callback list for registered components that I would be able to insert an entry into. Xlib is not designed that way (at least not in any documentation I can find).

To avoid having to hack the X window event delivery system I started to look at how these events are realized by X itself. In the guts of the device initialization configuration there is something similar to the following:

Section "InputClass"
    Identifier "evdev keyboard catchall"
    MatchIsKeyboard "on"
    MatchDevicePath "/dev/input/event*"
    Driver "evdev"
EndSection

which is using one of the /dev/input/event* devices. These are character devices set up by evdev to handle generic input events from a variety of sources: joysticks, mice, keyboards, and so on. One nice thing about these devices is they can be opened and read from as if they were regular files. So, if I can figure out which of the /dev/input/event* devices corresponds to the keyboard I should have access to the events that X is handing off to the child windows.

It turns out that there are two directories that exist to facilitate this type of search: /dev/input/by-id/ and /dev/input/by-path/. Searching either of the two of them for something like *-kbd you can find the exact device linked to a keyboard (if you have multiple keyboards attached you will need to further disambiguate). For example, in my /dev/input/by-path/ there are the following:

pci-0000:00:04.0-event-mouse -> ../event4
pci-0000:00:06.0-usb-0:1:1.0-event-mouse -> ../event3
pci-0000:00:06.0-usb-0:1:1.0-mouse -> ../js0
platform-i8042-serio-0-event-kbd -> ../event2
platform-i8042-serio-1-event-mouse -> ../event5
platform-i8042-serio-1-mouse -> ../mouse1

According to this (and some mappings provided in /usr/include/linux/input.h) I can now collect all keystrokes generated by my machine from /dev/input/event2 without having to devise a way to convince X to hand them over.