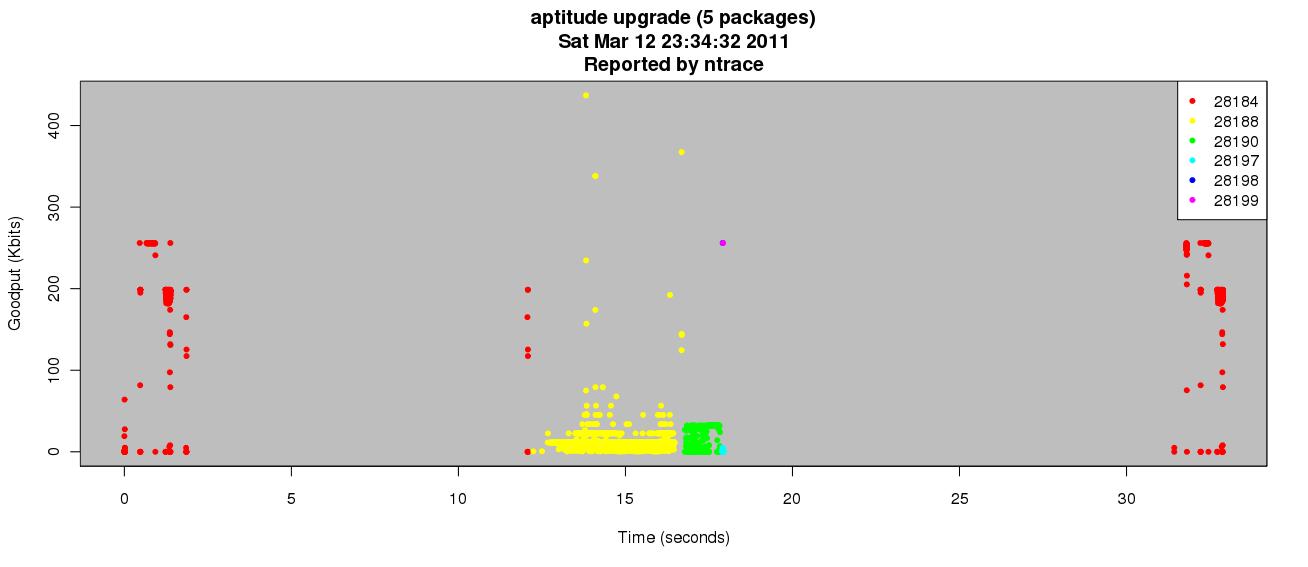
[Update] This code can now be found on github (
ntrace)
In the
previous post in this series, I described the similarities between strace and LD_PRELOAD and why you may opt to use one over the other. This is the final post in the series where I provide a situation where strace is inadequate and LD_PRELOAD becomes a more appropriate tool.
The contrived example provided earlier was trivial but this example is one that I have run across and was the catalyst for this set of posts. The situation I faced is that I had to understand how an application was interacting with the host system to communicate with the network. I needed a way to instrument this application to provide concise details about how changes being made at the transport layer were affecting the upper-layer protocols (i.e. performance).
This sounds straightforward considering the explanation of strace so far - and for the most part it is... but there are caveats. Let's consider the following piece of code:
/*
 * reads from the net, writes to a pipe
 */
void read_client (int sock, int fd) {
    ssize_t n = 0;
    char buff[2048] = {0};
    while ((n = recv (sock, buff, 2048, 0)) > 0) {
        /* write data to the pipe */
        write (fd, buff, n);
    }
}
The setup for this call is that there is a server that handles connections by setting up a pipe, forking a new process, and allowing the child process to read from the connection and write that data to the pipe. The parent then handles the data from the pipe and not directly from the network connection. The above call receives the network connection (
sock) and write end of the pipe (
fd) as parameters. So far, there is nothing that precludes us from using strace with the proper flags to monitor the behavior of this process. For example:
strace -f -e trace=network -o trace.log ./recv_example
provides the following bit of output
13328 socket(PF_INET, SOCK_STREAM, IPPROTO_IP) = 3
13328 bind(3, {sa_family=AF_INET, sin_port=htons(41477), sin_addr=inet_addr("0.0.0.0")}, 16) = 0
13328 listen(3, 10)                     = 0
13328 accept(3, {sa_family=AF_INET, sin_port=htons(36412), sin_addr=inet_addr("127.0.0.1")}, [16]) = 4
13362 recv(4, "\0\0\0\0\0\0\0\0\0\0\0\0\0\0\0\0\0\0\0\0\0\0\0\0\0\0\0\0\0\0\0\0"..., 2048, 0) = 2048
13362 recv(4, "", 2048, 0)              = 0
13328 --- SIGCHLD (Child exited) @ 0 (0) ---
We can see that strace only caught the network-related calls, followed the fork, realized the recv call in the child, and that the server received 2048 bytes from the network. This would be enough to accomplish the goal... but there are caveats.
As it turns out, not everyone follows the same approach when reading/writing to network sockets. For instance, the function described above could have been written using the read system call instead and would perform in
exactly the same way. Consider the following change:
--- read_example.c 2010-12-03 10:44:32.000000000 -0500
+++ recv_example.c 2010-12-03 10:44:43.000000000 -0500
@@ -18,7 +18,7 @@
 void read_client (int sock, int fd) {
     ssize_t n = 0;
     char buff[2048] = {0};
-    while ((n = read (sock, buff, 2048)) > 0) {
+    while ((n = recv (sock, buff, 2048, 0)) > 0) {
         /* write data to the pipe */
         write (fd, buff, n);
     }
Now our strace approach gets slightly more complicated. Using the exact same flags as above our log now contains the following after a run:
14126 socket(PF_INET, SOCK_STREAM, IPPROTO_IP) = 3
14126 bind(3, {sa_family=AF_INET, sin_port=htons(41477), sin_addr=inet_addr("0.0.0.0")}, 16) = 0
14126 listen(3, 10)                     = 0
14126 accept(3, {sa_family=AF_INET, sin_port=htons(36418), sin_addr=inet_addr("127.0.0.1")}, [16]) = 4
14126 --- SIGCHLD (Child exited) @ 0 (0) ---
Notice the absence of the read call? According to -e trace=network, read is not a network-related system call. Fine. Easy fix, we just add the read call to the list of calls to trace and be done with it.
strace -f -e trace=network,read -o trace.log ./recv_example
Unfortunately, that only further muddies the water.
14130 read(3, "\177ELF\1\1\1\0\0\0\0\0\0\0\0\0\3\0\3\0\1\0\0\0\200\257\274\0004\0\0\0"..., 512) = 512
14130 socket(PF_INET, SOCK_STREAM, IPPROTO_IP) = 3
14130 bind(3, {sa_family=AF_INET, sin_port=htons(41477), sin_addr=inet_addr("0.0.0.0")}, 16) = 0
14130 listen(3, 10)                     = 0
14130 accept(3, {sa_family=AF_INET, sin_port=htons(36419), sin_addr=inet_addr("127.0.0.1")}, [16]) = 4
14132 read(4, "\0\0\0\0\0\0\0\0\0\0\0\0\0\0\0\0\0\0\0\0\0\0\0\0\0\0\0\0\0\0\0\0"..., 2048) = 2048
14132 read(4, "", 2048)                 = 0
14130 --- SIGCHLD (Child exited) @ 0 (0) ---
14130 read(5, "\0\0\0\0\0\0\0\0\0\0\0\0\0\0\0\0\0\0\0\0\0\0\0\0\0\0\0\0\0\0\0\0"..., 2048) = 2048
14130 read(5, "", 2048)                 = 0
Now we are getting
all of the read calls including those related to loading ELF binaries, reading from the pipe in the parent process, and the network call. This magnifies as you consider the number of ways these calls can be arranged.
What this is really telling us is that the information we desire is buried in context - it dependent upon state.
This is where LD_PRELOAD with a shim library becomes appropriate. What we'd really like to do is take every way that a developer can interact with a network file descriptor and monitor those calls but with the added benefit of knowing something about the file descriptor itself. In the previous output we could build the state from the trace - parse out the return values for the system calls, associate them with a particular behavior, etc. That's not entirely true since, at that point, we would need to trace all calls (pipe, for instance) but it would get us close. That is error prone and tedious. If the format of the output changes or the flags to strace weren't just so we'd need to adjust.
It is much better to have that state build up with the execution of the program and remain resident until the program exits. The solution presented here is well beyond the needs of this small example but it exposes how we can overcome the limitations of strace when the occasion calls for it.
If we use this shim library tool on the second program above (the one using read instead of recv) we get two files - one for each process: 14228.log and 14230.log. In this case, 14228 is the parent process and reads from the pipe while 14230 is reading from the network and writing to the pipe. These files recap the overall activity of each process and solve the issue exactly. We now see what operations are related to the network - the top of each file provides call-by-call details - and we don't need to worry about changes to external flags or output format to ensure proper operation.
14228.log
call,fd,pid,seq,time,size,recv_so_far,send_so_far

Network totals: (0, 0)
     read : 0 (0)
     recv : 0 (0)
 recvfrom : 0 (0)
  recvmsg : 0 (0)
    write : 0 (0)
     send : 0 (0)
   sendto : 0 (0)
  sendmsg : 0 (0)

Pipe:14228:8 (2048,0)
Pipe totals: (2048, 0)
     read : 2 (2048)
     recv : 0 (0)
 recvfrom : 0 (0)
  recvmsg : 0 (0)
    write : 0 (0)
     send : 0 (0)
   sendto : 0 (0)
  sendmsg : 0 (0)

Disk totals: (0, 0)
     read : 0 (0)
     recv : 0 (0)
 recvfrom : 0 (0)
  recvmsg : 0 (0)
    write : 0 (0)
     send : 0 (0)
   sendto : 0 (0)
  sendmsg : 0 (0)
call,fd,pid,seq,time,size,recv_so_far,send_so_far
read,7,14230,0,1291401018.139170,2048,2048,0
read,7,14230,0,1291401018.139199,0,2048,0

Network:14230:7 (2048,0)
Network totals: (2048, 0)
     read : 2 (2048)
     recv : 0 (0)
 recvfrom : 0 (0)
  recvmsg : 0 (0)
    write : 0 (0)
     send : 0 (0)
   sendto : 0 (0)
  sendmsg : 0 (0)

Pipe:14230:9 (0,2048)
Pipe totals: (0, 2048)
     read : 0 (0)
     recv : 0 (0)
 recvfrom : 0 (0)
  recvmsg : 0 (0)
    write : 1 (2048)
     send : 0 (0)
   sendto : 0 (0)
  sendmsg : 0 (0)

Disk totals: (0, 0)
     read : 0 (0)
     recv : 0 (0)
 recvfrom : 0 (0)
  recvmsg : 0 (0)
    write : 0 (0)
     send : 0 (0)
   sendto : 0 (0)
  sendmsg : 0 (0)
We can also get an strace-like output that allows us to find out exactly what is happening during execution. This is helpful to understand the internals of the program and is exactly what strace provides but we get it (and the added state) for free. Notice in the output below that each operation on a file descriptor is classified (NET vs. PIPE).
** DEBUG (14228) ** Initialized the debug channel
 ** DEBUG (14228) **  Created process state 0x8e51008. pid: 14228, ppid: 4285, thid: -1208371520
 ** DEBUG (14228) **  Setting up traffic on fd 0
 ** DEBUG (14228) **   Details:
 ** DEBUG (14228) **   Disk oriented
 ** DEBUG (14228) **  Setting up traffic on fd 1
 ** DEBUG (14228) **   Details:
 ** DEBUG (14228) **   Disk oriented
 ** DEBUG (14228) **  Setting up traffic on fd 2
 ** DEBUG (14228) **   Details:
 ** DEBUG (14228) **   Disk oriented
 ** DEBUG (14228) ** socket (2, 1, 0) = 6
 ** DEBUG (14228) **  Setting up traffic on fd 6
 ** DEBUG (14228) **   Details:
 ** DEBUG (14228) **   Network oriented
 ** DEBUG (14228) ** bind (6, 0xbfeeae20, 16) = 0
 ** DEBUG (14228) ** accept (6, 0xbfeeae10, 16) = 7
 ** DEBUG (14228) **  Setting up traffic on fd 7
 ** DEBUG (14228) **   Details:
 ** DEBUG (14228) **   Network oriented
 ** DEBUG (14228) ** pipe ([8, 9]) = 0
 ** DEBUG (14228) **  Setting up traffic on fd 8
 ** DEBUG (14228) **   Details:
 ** DEBUG (14228) **   Pipe oriented
 ** DEBUG (14228) **  Setting up traffic on fd 9
 ** DEBUG (14228) **   Details:
 ** DEBUG (14228) **   Pipe oriented
 ** DEBUG (14230) ** Initialized the debug channel
 ** DEBUG (14230) **  Copying process details from parent 14228 (getppid: 14228)
 ** DEBUG (14230) **  Rehashing fd 0 (disk)
 ** DEBUG (14230) **  Rehashing fd 1 (disk)
 ** DEBUG (14230) **  Rehashing fd 2 (disk)
 ** DEBUG (14230) **  Rehashing fd 6 (net)
 ** DEBUG (14230) **  Rehashing fd 7 (net)
 ** DEBUG (14230) **  Rehashing fd 8 (pipe)
 ** DEBUG (14230) **  Rehashing fd 9 (pipe)
 ** DEBUG (14230) ** close (8) = 0
 ** DEBUG (14230) **  (Exiting fd 8)
 ** DEBUG (14230) **   network     : no
 ** DEBUG (14230) **   disk        : no
 ** DEBUG (14230) **   pipe        : yes
 ** DEBUG (14230) **   active      : yes
 ** DEBUG (14230) **   has_hb      : no
 ** DEBUG (14230) ** [ NET] read (7, 0xbfee9dc0, 2048) = 2048
 ** DEBUG (14230) **  fd 7 used for the first time
 ** DEBUG (14230) **  spawing thread for fd 7
 ** DEBUG (14230) **  Detail
 ** DEBUG (14230) **   delay (in usec)    : 1000000
 ** DEBUG (14230) **  thread created: -1208374368
 ** DEBUG (14230) ** [PIPE] write (9, 0xbfee9dc0, 2048) = 2048
 ** DEBUG (14230) ** [ NET] read (7, 0xbfee9dc0, 2048) = 0
 ** DEBUG (14230) ** close (9) = 0
 ** DEBUG (14230) **  (Exiting fd 9)
 ** DEBUG (14230) **   network     : no
 ** DEBUG (14230) **   disk        : no
 ** DEBUG (14230) **   pipe        : yes
 ** DEBUG (14230) **   active      : yes
 ** DEBUG (14230) **   has_hb      : no
 ** DEBUG (14230) **  [atexit]
 ** DEBUG (14230) ** _exit (0) = ...
 ** DEBUG (14230) **  Cleanup. Stopping any active threads
 ** DEBUG (14230) **  < joining with thread -1208374368 ... >
 ** DEBUG (14228) ** close (9) = 0
 ** DEBUG (14228) **  (Exiting fd 9)
 ** DEBUG (14228) **   network     : no
 ** DEBUG (14228) **   disk        : no
 ** DEBUG (14228) **   pipe        : yes
 ** DEBUG (14228) **   active      : yes
 ** DEBUG (14228) **   has_hb      : no
 ** DEBUG (14230) **  < ... join complete >
 ** DEBUG (14228) ** [PIPE] read (8, 0xbfeea600, 2048) = 2048
 ** DEBUG (14228) ** [PIPE] read (8, 0xbfeea600, 2048) = 0
 ** DEBUG (14228) ** close (8) = 0
 ** DEBUG (14228) **  (Exiting fd 8)
 ** DEBUG (14228) **   network     : no
 ** DEBUG (14228) **   disk        : no
 ** DEBUG (14228) **   pipe        : yes
 ** DEBUG (14228) **   active      : yes
 ** DEBUG (14228) **   has_hb      : no
 ** DEBUG (14228) ** close (7) = 0
 ** DEBUG (14228) **  (Exiting fd 7)
 ** DEBUG (14228) **   network     : yes
 ** DEBUG (14228) **   disk        : no
 ** DEBUG (14228) **   pipe        : no
 ** DEBUG (14228) **   active      : yes
 ** DEBUG (14228) **   has_hb      : no
 ** DEBUG (14228) ** close (6) = 0
 ** DEBUG (14228) **  (Exiting fd 6)
 ** DEBUG (14228) **   network     : yes
 ** DEBUG (14228) **   disk        : no
 ** DEBUG (14228) **   pipe        : no
 ** DEBUG (14228) **   active      : yes
 ** DEBUG (14228) **   has_hb      : no
 ** DEBUG (14228) **  [atexit]
 ** DEBUG (14228) ** _exit (0) = ...
 ** DEBUG (14228) **  Cleanup. Stopping any active threads